ER Portfolio Performance: 2/2005 - 1/2006
I'm going to start publishing my portfolio's monthly performance. The blue bars represent the portfolio's monthly return and the line is the theoretical growth of $1 from the beginning on the period (click the graph to see a full size image).

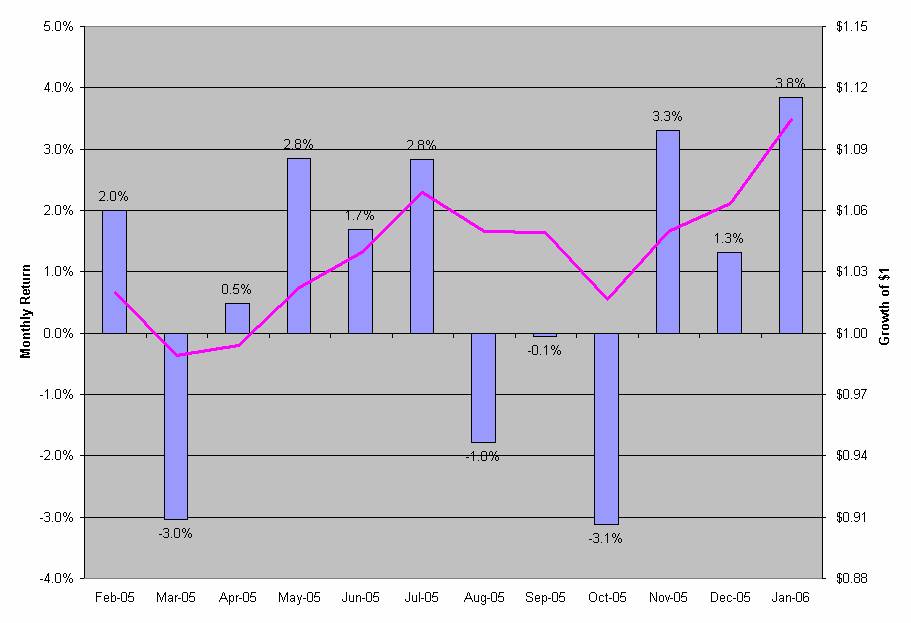
My average monthly return for this period is 0.86% with a standard deviation of 2.4%. I'm interested to see if my recent asset class diversification will reduce the variability of the portfolio.
posted by Early Riser @ 7:04 AM
0 comments
![]()
![]()


0 Comments:
Post a Comment
<< Home