Personal Financial Ratios from the FPA Journal
I recently read an interesting article from a professional financial planning journal that used three relatively simple ratios to diagnose your financial health. Here's a link and their executive summary...FPA Journal - Personal Financial Ratios: An Elegant Road Map to Financial Health and Retirement:
"Investors commonly use stock ratios such as the price to earnings, price to book, and dividend yield to assess the financial health of a company because the ratios concisely benchmark a company's financial status.
Clients and their financial advisors have no comparable ratios that would allow investors to conduct a similar analysis of their personal financial circumstances. This article establishes a set of personal financial ratios that individuals can use to analyze their financial standing. Just as stock ratios are primarily based on a company's earnings, the personal financial ratios are based on an individual's income. There are three ratios: savings to income, debt to income, and savings rate to income.
The ratios are derived from a series of assumptions including household budgets, post-retirement income replacement, rates of return, and retirement distribution rates.
The ratios are designed to serve as a road map so that investors can compare their individual ratios against the benchmarks to determine whether they are on track to retire by age 65. The ratios serve as a practical tool for advisors to help convey to their clients the fundamental relationship between one's income, debt, and savings rate, and how those relationships must change over time."
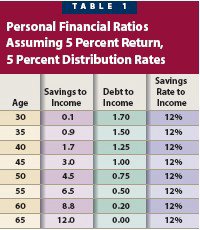
The ratios are pretty straight-forward...
- S/I - Savings to Income - savings is defined as all of your assets EXCEPT your primary residence and income is your gross annual income from employment
- D/I - Debt to Income - debt includes mortgage, car loans / leases, educational loans, etc.
- SR/I - Savings Rate to Income - savings rate is the annual amount you are saving including employer match for 401k. It should not include the earnings on those savings.
Here's a (much) more conservative table assuming lower market returns and a lower withdrawal rate...
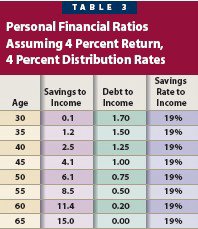
Here are my ratios and my financial age based on the more conservative table:
- S/I - 3.9 - 44
- D/I - 1.7 - 30
- SR/I - 30% - ??
I have a small beef with the author's separation of assets and debt into to separate ratios. I would suggest that you could combine them into: INW/I - investable net worth to income. Simply subtract your D/I from your S/I. My INW/I is 2.2 which would translate to a financial age of 42 or 43.
It looks like I'm on track to hit my magic number (i.e. have enough money to live Harry Newton's life of managing my investments full-time) before I reach 65. I like the simple-to-track goal of accumulating 15 times your salary. I was just commenting to my wife that we're doing well financially but that we really don't have any concrete goals.
I'll continue to watch my ratios and I encourage you to calculate yours and share them with my readers.
posted by Early Riser @ 2:04 PM
3 comments
![]()
![]()


3 Comments:
Interesting article, ER. Since I've retired, I don't know if these ratios would mean anything now, since they all divide by income, which the article says comes from employment. I did it as of the last day of my work. I came up with
S/I=5.98
D/I=0.908
SR/I= 0.158
Did you hear about another ratio that I heard about? Lee Eisenberg wrote a book entitled "The Number", which is Expenses divided by return on investments. For example, if expenses are $60,000 and your investments earn 5%, then your Number is 60,000/0.05 = $1.2 million.
The debt calculation oddly punishes you for owning a home. There's no benefit for equity - only a penalty for the debt.
You are in a much better financial situation with your home paid off as opposed to renting.
Heh, interesting that we're tracking very similarly even though our lives are pretty different and we're different ages:
S/I = 3.6
D/I = 1.4
SR/I = 25%
I think I'll still hit my goal of semi-retirement in 10 years, even though I'm close to my age in those charts. It's the power of being a cheapass!
--yer sister
Post a Comment
<< Home